
What Do YIMBYs and Donald Trump Have in Common?
[ first published nov 2024; updated july 2026 ]
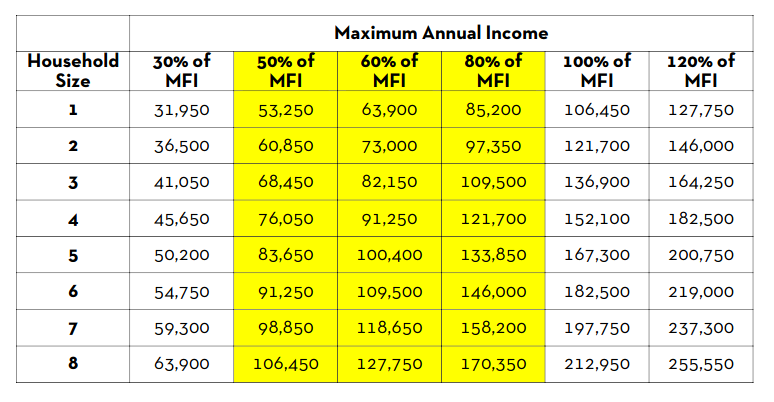
- YIMBYs and Trump are consistently complicit in the offloading of vast amounts of public property to friends in the speculative real estate market, prioritizing commodified luxury housing focused on serving their speculator investors and affluent singles while ignoring real affordability needs of DC’s working families who are making the DC minimum wage or anyone making less than $65,000/yr. https://savedcpublicland.org/the1617project/2023/06/09/dcs-sordid-track-record-of-public-land-giveaways/
- Both Trump and YIMBYs ignore or dismiss genuine solutions that could provide DC and cities across the nation the truly affordable housing it deserves. Instead of deploying programs such as custom zoning and social housing, Trump and YIMBYs favor private developers doing the lifting and grifting instead of strong municipal initiatives like that happening around the nation. Worse yet, Trump and YIMBYs go further and actively endorse the privatization of public housing through “repositioning” programs that give away acres upon acres of public land. https://ggwash.org/view/97236/dcs-public-housing-agency-is-making-halting-progress-but-much-more-needs-to-be-done
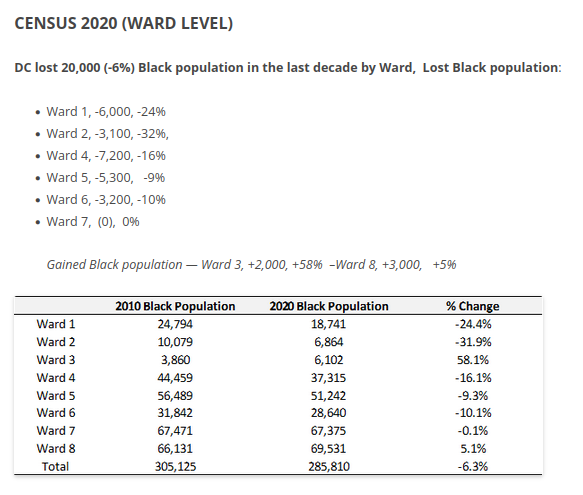
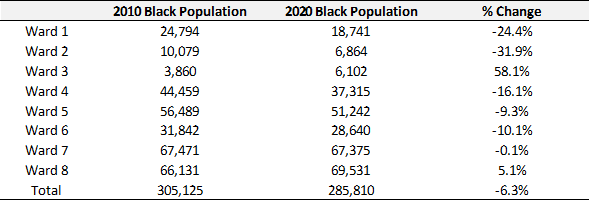
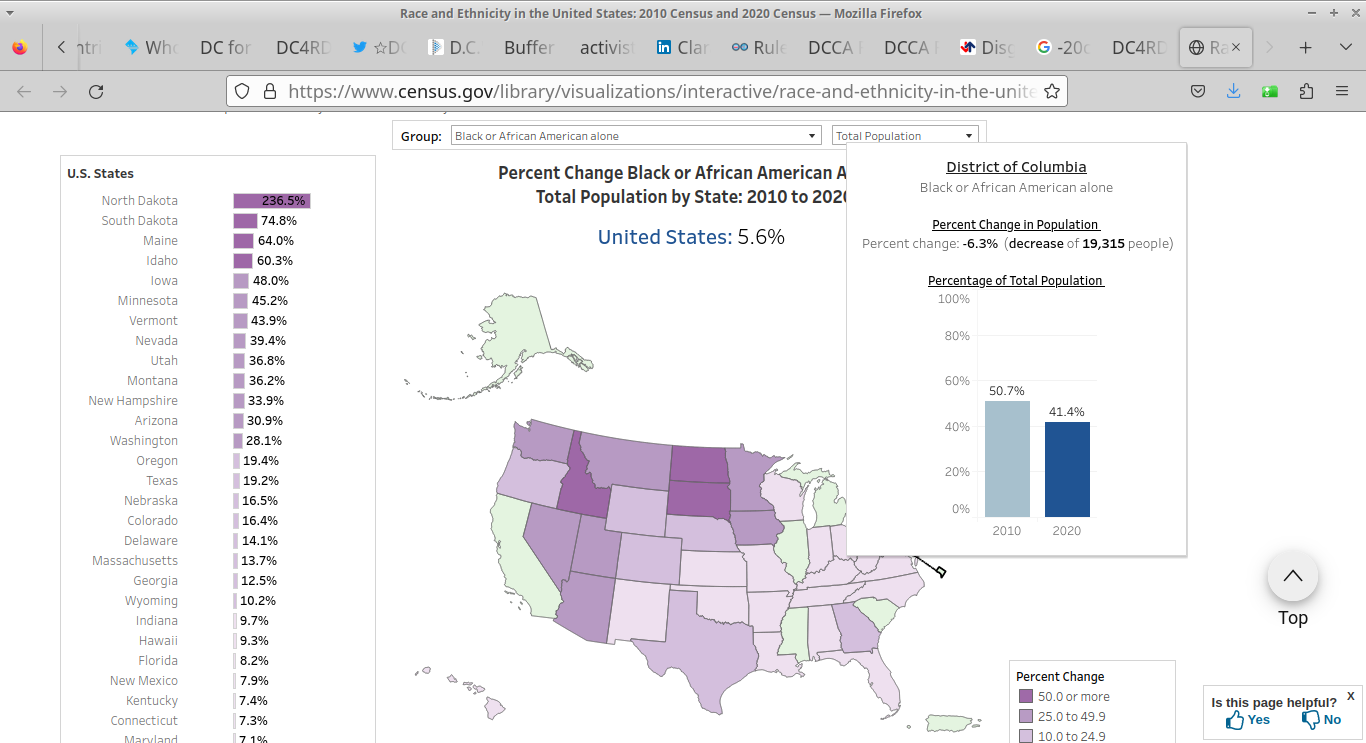
- Both YIMBYs and Donald Trump share a deeply troubling agenda that displaces lower-income working families and people of color from their rooted neighborhoods without much concern or acknowledgement (60,000+ Black residents displaced from DC over the past two decades of “build more”). This is seen vividly in Washington, D.C., where our city consistently ranks among the top cities for gentrification, with devastating impacts on longstanding Black communities with barely a blush by YIMBYs. https://journals.sagepub.com/eprint/EVDFHVYYVVSXWIYMPVQ9/full
- [new july 2026] Donald Trump is storming forward to deregulate any oversight — community input and design review — especially as it regards historic properties and irreplaceable cultural assets to YIMBY cheers.
From District Links dated July 27, 2026
Preservation and environmental groups are decrying proposed changes advanced by a federal panel that would upend what’s known as the Section 106 review process, named for the relevant section of the National Historic Preservation Act and applicable to an array of projects that involve historic sites under federal ownership.
The push comes as President Donald Trump and administration officials seek to clear the path for proposed projects such as a monumental arch at the foot of Memorial Bridge that would otherwise trigger a lengthy review process. They’ve complained that current procedures are overly complex and restrictive — a common refrain among proponents of projects held up by Section 106 reviews.
After a vote Friday by the federal government’s Advisory Council on Historic Preservation, the rulemaking proposal will now move to an “interagency review process” overseen by the Office of Management and Budget prior to publication in the Federal Register, according to an announcement.
“Public participation is a founding principle of this democracy, and today’s vote treats it as an obstacle to be removed,” Illya Azaroff, president of the American Institute of Architects, said in a statement. “When communities lose their voice in decisions about the places that shape their lives, we all lose something that cannot easily be recovered.”
The National Trust for Historic Preservation — a statutory member of the 24-member Advisory Council on Historic Preservation, which is otherwise comprised primarily by presidential appointees and federal officials — noted that it “vehemently opposes” the changes as written and criticized the process that led to the recommendations.
“If implemented, federal agencies will no longer be required to avoid or minimize damage to our nation’s historic sites and landscapes, or seek public input on federal projects that would impact historic places,” Brent Leggs, CEO of the National Trust for Historic Preservation, said in a statement.
— ‘Trump officials vote to rewrite historic preservation rules, in boon for arch.’ WaPo’s Dan Diamond and Jake Spring: “Trump officials on Friday voted to rewrite federal rules intended to protect historic sites, sending the plan to the White House for further review.
“The Advisory Council on Historic Preservation, a federal agency that oversees preservation reviews and advises the president and Congress, said it was moving forward with changes to a federally required process that governs changes to landmarks such as the National Mall, sites that are significant to Indigenous tribes and other properties eligible for listing on the National Register of Historic Places. The process currently applies to any construction projects that are on federal land or receive federal funding, as well as private projects that require any type of federal approval.” [WaPo]
— ‘Trump-backed historic preservation panel approves controversial rules change.’ WBJ’s Drew Hansen: “The changes should help expedite President Donald Trump’s planned 250-foot arch near Arlington National Cemetery as well as perhaps other changes he has floated around the National Mall. The Trump administration has bemoaned reviews related to the arch project, calling them burdensome. The administration has been looking to make quick work of various projects so they can be completed before the end of Trump’s term in early 2029.” [WBJ]
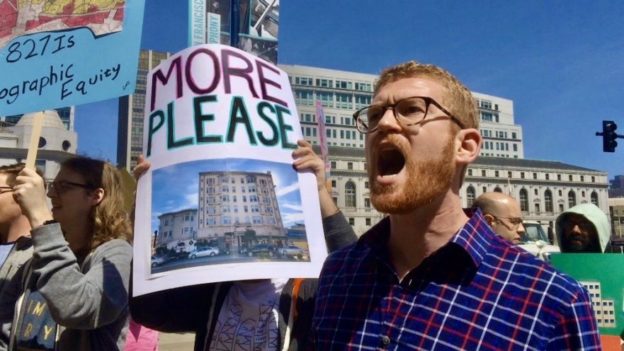
YIMBYs don’t have to care about the impacts of their build-baby-build rhetoric because they are privileged enough not to bear the adverse brunt of their advocating to privatize public land and build more luxury units, this same policy that benefits the exact class of real estate players who fund campaigns of politicians like Donald Trump.
#IZFAIL
But wait there’s more
. . .
Find out why the YIMBY “affordability” program in DC, called “Inclusionary Zoning” or “IZ”, is an absolute fraud perpetuated to guise the overblown and continuing construction of mostly unaffordable market-rate luxury housing units despite the growing racial disparity and displacement in DC.
- IZ Fraud Explained, Part 1 (AMI) :: https://www.youtube.com/watch?v=Y3_Hf_84Mn0
- IZ Fraud Explained, Part 2 (Waiting Lists & Funding) :: https://www.youtube.com/watch?v=nbvxR-r4lyw
Other links of import::
- The DC Citizens Forum: Washington Was An Icon Of Black Political Power. Then Came Gentrification, by NCRC, January 29, 2024, https://ncrc.org/the-dc-citizens-forum-washington-was-an-icon-of-black-political-power-then-came-gentrification/
- “Studying Gentrification on One Block in DC: The Many Problems of Following People Around.” UMD, Dr. Johanna Bockman, March 2024, https://www.youtube.com/watch?v=Am28wMWnG-4
- Review of “Before Gentrification: The Creation of DC’s Racial Wealth Gap” by Tanya Maria Golash-Boza, Review published by Oxford Academic, August 30, 2024, “Golash-Boza’s narrative connects the thread of how Black residents, once abandoned in declining neighborhoods, were taken off the streets by incarceration and displaced by gentrification”, https://academic.oup.com/sf/article-abstract/103/2/e15/7746085
- The Black Broadway: Washington D.C.’s U Street, by Ennis Davis, Nov 14, 2023, https://www.moderncities.com/article/2023-nov-the-black-broadway-washington-dcs-u-street