—


—
The rising cost of housing is putting more Americans on the street than ever before.
The homeless population in the U.S. has increased by 11% this year compared to 2022, according to a preliminary data analysis by The Wall Street Journal. Though the U.S. Department of Housing and Urban Development plans to release finalized data later this year, anything close to the WSJ's preliminary figure would represent a record since HUD began its current method of data collection in 2007.
The previous biggest single-year jump in homelessness was 2.7% from 2018 to 2019, excluding the 2022 increase driven by a pandemic-affected undercount in 2021, the WSJ reports. The data collection method used by the WSJ and HUD, called a point-in-time count, routinely undercounts the true homeless population, but this year's preliminary figure counted at least 577,000 unhoused persons.
The single biggest driver of homelessness in the U.S. is rising housing costs, which persist even as inflation recedes from the rest of the economy. Shelter accounted for 90% of total inflation in July's consumer price index. Despite increased attention on the risk of homelessness for vulnerable populations, funding for support programs remains low.
Unhoused populations cluster in U.S. cities, but at varying rates. Denver's point-in-time count showed a 32% increase in homelessness, while Los Angeles recorded a 10% jump this year, the WSJ reports. New Orleans showed a 15% increase in homelessness, reversing improvements made in the first two years of the pandemic.
Despite affordable housing's scarcity, the overall supply of rental housing is increasing at a record pace, suppressing rent growth and imperiling some landlords that took out loans when the market was at its hottest. But that increased supply is vastly overweighted to the most expensive units, CoStar reports.
For at least seven consecutive quarters, over 70% of new U.S. apartment deliveries have been in the two most expensive rent tiers, CoStar reports. That trend is poised to continue this year, when over 500,000 more apartments are expected to deliver.
In those two most expensive tiers, rents decreased in the second quarter and vacancy rose to 9.1% after hitting a low of 6.5% in 2021, CoStar reports. In the Sun Belt, the reversal has been the most dramatic, with rents in the two most expensive tiers decreasing 4.5% in Austin, Texas, in Q2.
Contact Matthew Rothstein at matt.rothstein@bisnow.com
Fudge: “Everybody in the country knows we have a crisis of affordable housing. But the only way to get costs down is to assist developers and builders in building more homes. If we don't put more supply on the market the prices are not going to go down. … Help us find ways to deal with our zoning and our restrictions, so we can streamline the process.”
===
Questions:
===
Contrast the above video, with this Adams Curtis video: https://www.youtube.com/watch?v=BAwH7R5ljo8
“This is the normal world. You go to work in a city. All around you are enormous new buildings. They look alike. You will never be able to afford to live in them because they are not really homes. They are blocks of money bought by global investors whose money has nowhere else to go.”
And, consider these points/analysis posts about housing production in DC:
http://www.dc4reality.org/updates/687
• Compare and Contrast: Growth & Displacement
—

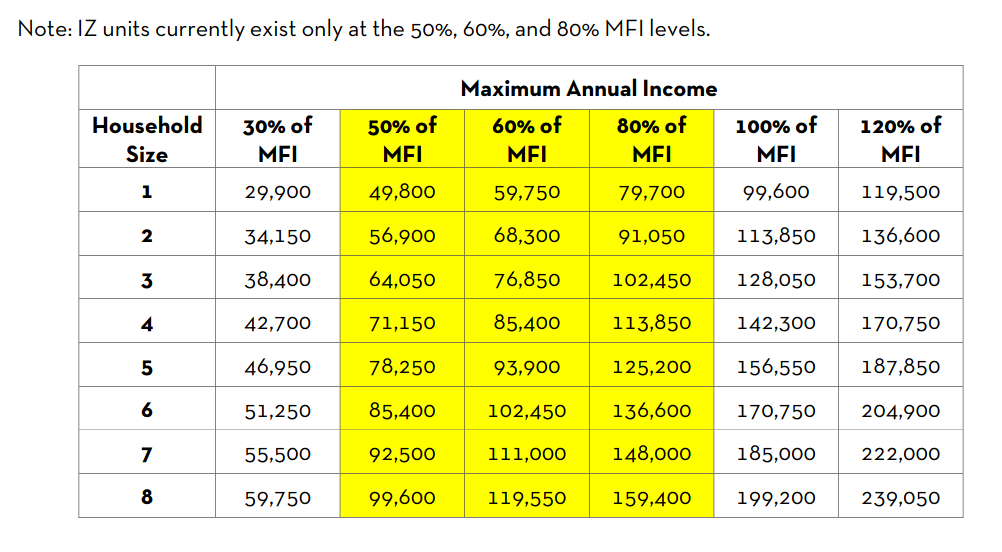
How is any of this acceptable to you Greg or for anyone holding any of the levers of power to change things immediately, why isn’t it getting done? Meanwhile the harm persists and you want to rail against those pointing it out and trying to find solutions. Make it make sense. Please.
Sources:
* Report, DC Mayor Muriel Bowser, “Inclusionary Zoning Annual Report for Fiscal Year 2021” dated January 9, 2023, https://lims.dccouncil.gov/downloads/LIMS/52021/Introduction/RC25-0002-Introduction.pdf
* Article, Washington Business Journal, “D.C.'s inclusionary zoning program not benefiting lowest-income households, report finds” by Tristan Navera, February 6, 2023, https://archive.ph/ghkMx

2. Beyond the IZ fail, recent reports show that DC's Housing Production Trust Fund has been similarly serving for the most part moderate income single professionals making $60,000+/yr. And, this fact stands in the face of law requiring that the majority of the HPTF monies are to subsidize housing for the lowest income earners (aka those making the living wage annually or less).
Sources:
Sources:
* DC Zoning Commission Case Nos. 11-03, A-K (https://app.dcoz.dc.gov/Home/ViewCase?case_id=11-03)
* Tweet, DC for Reality, “Let's not get it confused. When anyone (the Mayor; Developers, anyone) touts a project has 'affordable housing it may likely mean housing for individuals making $80-$120k a year as currently defined! DC needs to do better” dated February 10, 2023, https://twitter.com/dc4reality/status/1624111925494706177
The rubbing of metal wheels on tracks, or brakes on wheels, shears off tiny metal particles that get kicked up into the air as trains move.


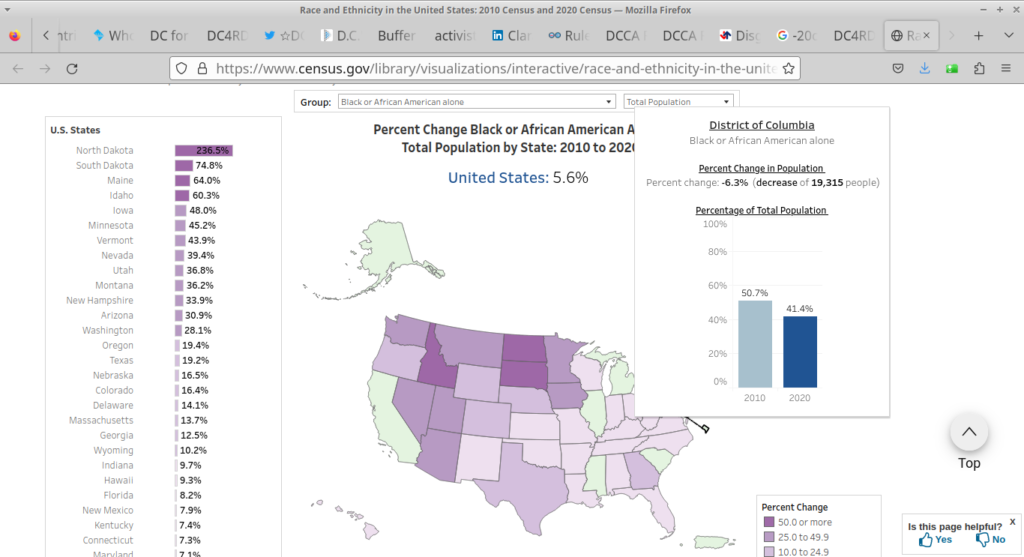
When the 2020 US Census numbers were published in 2021, local press guise the massive displacement of Black folks from D.C. as “integration” or “growing diversity” (over past 2 decades, 60k Black folks have been made gone from the city).
Also notably missing in any local census analysis is the fact that the ward scapegoated for being exclusive and segregated was one of two wards that increased in Black residents over the past 10 years.
DC lost 20,000 (-6%) Black population in the last decade by Ward, Lost Black population:

In response to all the amazing comments to this post
Here are some of the key sources we can relay that support the Census chart demonstrated above and showing that Ward 3 increased in Black residents while the rest of the city (except Wards 7 and 8) saw the startling displacement of longtime residents who identify as “Black-alone” on the 2020 US Census.
First, going to OP’s index of all the sources regarding the 2020 census >> https://planning.dc.gov/publication/2020-census-information-and-data
From the OP index and one table in, find this chart.
Using the charts from OP, review the 2020 DC Census by Ward analysis provided by Blaine Stum, The Legislative Policy Advisor for the Office of Chairman Phil Mendelson :: https://mobile.twitter.com/Blaine_Stum/status/1425885669113712651
Then below, find snapshots of the US Census website demonstrating the startling numbers of DC Black displacement which you can access here >> https://www.census.gov/library/visualizations/interactive/race-and-ethnicity-in-the-united-state-2010-and-2020-census.html
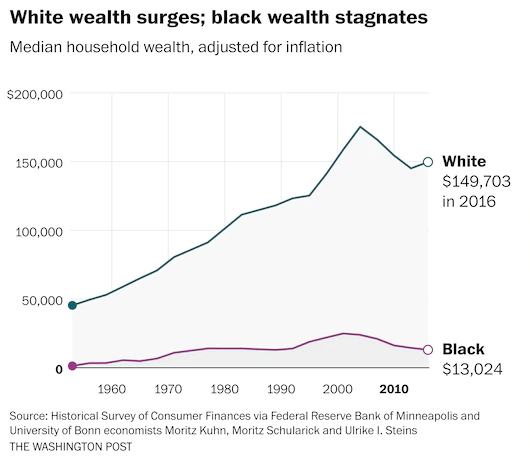
Also to note among the Census data points is the racial wealth income gap, a stark reality for those living and working in D. See the Washington Post Analysis, Economy, “The black-white economic divide is as wide as it was in 1968, Economy” By Heather Long and Andrew Van Dam, dated June 4, 2020, “… [T]he gap between the finances of blacks and whites is still as wide in 2020 as it was in 1968, when a run of landmark civil rights legislation culminated in the Fair Housing Act in response to centuries of unequal treatment of African Americans in nearly every part of society and business.” https://archive.ph/thnvI#selection-1621.0-1621.303
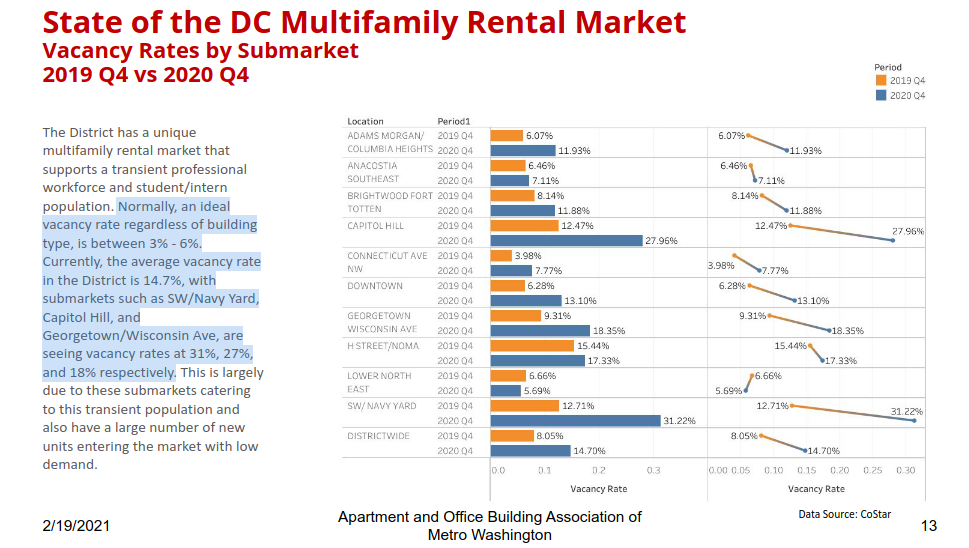
(AOBA report 2019-2021 at p.13). Imagine now, how and why the blue-ist city in the nation can define “Housing Affordability” as a housing unit affordable for an individual making 120K/yr.
It is a preeminent policy failure that harms Black DC and increases displacement pressures each time you hear a developer, the Mayor, anyone say they are constructing “affordable housing.” See more here >> https://twitter.com/dc4reality/status/1624111925494706177